HOW TO POSTS: LIGHTING AND COMPOSITION
what is a histogram
understanding how to use a histogram
WRITTEN BY: BRUCE LOVELACE
UPDATED: December 2, 2023

What is a histogram and how can it help us when we take photos. You've heard the term mentioned several times, but what is a histogram in photography and how can they help when you shoot photos?
Why do you need to know anything about photography histograms? This post will help you understand what they are, why you should use them, and how to improve your photo exposure by looking at your histogram.
Simply put, a histogram is a useful tool to help you check and adjust the exposure of a photo if needed. Histograms are simple graphs that shows you how the dark, middle tone, and bright areas of your photograph are distributed within your composition.
For much of the digital photography you do, you don't to need to look at your image's histogram, but there are other times where you will find them extremely helpful.
Stay with me here for a second. Particularly with many average scenes that you photograph, digital cameras usually get the exposure just about right. It's an auto-exposure technology, right? Does it work perfectly? No.
Well, getting the perfect exposure most of the time is okay for some photographers, but, not you and me. It's frustrating when the camera doesn't quite get the done right. We're looking for a basic understanding of how looking at a histogram will help us adjust the exposure to give us the perfectly exposed photograph. This article will give you the understanding you need.
I found this short video that does a super job of explaining simple histograms. It doesn't cover color histograms in detail-we'll dive into that in a minute. If you watch this video you'll really get a great understanding of what a histogram is and how you can get the advantage of using it.
There are certain special situations when histograms are extremely valuable, not just for doing a quick check of the exposure. Histograms are great tools for using an advanced technology, but with a little of your common sense mixed in with practical thinking. Here's an example of what I mean by that.
histogram examples
Look at the family portrait below and its histogram to the right. If you watched the video above you understand that we generally don't want any of our pixels to be "clipped" off of the graph on the left side or the right side. In the family portrait, the part of the photo that really matters to us is our subject's faces.
 Histogram revealed clipped highlights
 but they were of the white wall in the sunlight behind my subjects.
A basic understanding of what they are and how histograms are used will help you improve you ability to get the right exposure when your camera's auto-exposure fails you.
definition of histogram in photography
A digital photography histogram is a graph that shows us the relative number of pixels from the darkest shadow areas of a photo through the brightest areas in that photo.
Digital camera meters and their built in processing software do a great job of estimating the correct exposure most the time. When you have an unusual subject or unusual lighting situation, these graphs are very valuable to help you understand how your photo was actually exposed.
Unusually dark or light subjects as well as situations of very high or very low contrast dictate the use of using a histogram. The two major warning signs show when the dark areas of the graph press against either side of the histogram. These are the two most common red flags that indicate a need to adjust the exposure. Look at the 3 histogram examples below each one of the photographs of my sleepy dog below.

You can see the three examples above with the snapshots of my dog "Mocha" sleeping on my office floor. The histograms for each photo are directly below them. In the left photo, it is clearly underexposed because the graph underneath that dark photo show a significant amount of the black area is touching the left side of the graph. If you kept the exposure at this level, you would lose details in the shadow areas and brightening when we do our photo editing would reveal lack of detail and too much digital noise in the edited photo.
The middle photo is properly exposed. The photo on the right is overexposed. It looks "about right" but if we look at the histogram we can see that the graph has an area that is against the right side of the graph. In this situation we have lost details in the highlight areas. Those highlight details are lost forever and can not be fixed with editing afterwards.
 Dark Subject. Dark Background.
This photo of the the dog is perfectly exposed. The histogram shows a large amount of dark pixels in the photo.
This leads the biggest mistake that you can make when it comes to understanding your histogram. Here's the warning. At a quick glance, you might think the image is underexposed, but it's not. When you see that most of the photograph's pixels are to the left-that's large amount of black shown in the shadow areas-you think the photo is too dark.
Most of the tones in this photograph are dark because the subject and the background ARE both dark. The histogram should most of the area of the photograph on the left side of the graph. Remember, the areas to the left are shadows and the are to the right are the lighter areas. The dark areas are not pressed up against the edge of the histogram.It is not under exposed.
The highlights, although they are few in number are properly showing at the right end of the histogram. There are also no black areas in the graph that is touching the left side of the histogram.
Once you get a basic understanding of them, digital photography histograms can be analyzed with a quick glance and you can adjust your exposure up or down with a quick adjustment of your camera settings.
The best way to learn more about them is to look at your histograms after taking several different photos with different subjects. You can have some fun by guessing ahead of time what your graph will look like. You will be surprised how much this will help you in those situations that need extra attention in getting the correct exposure for your digital photos.
what is a color histogram In Photography
Color histograms are a bit more sophisticated. They show pixels for the three separate color groups that make up our visual spectrum, red, green, and blue light. Digital camera sensors actually are built with separate red, green, and blue sensitive pixels and the cameras combine them to give us all of those millions of different colors in the color spectrum.
 Red is dominant color.
The histograms shown earlier in this article are the simplest and most commonly used for the majority of photographers. You can see both the color and the simple histogram that came from this photo of the red rose.
With subjects that are highly saturated with one of the three color groups, one of the colors may actually be overexposed. This color histograms of the red flower shows the red pixels are pushed off the scale. These overexposed red pixels are not revealed in the simple combined histogram.
Color Histograms can reveal color imbalances
In the following histogram, the blue pixels are squished up again the right edge of the histogram. The camera was erroneously set to a tungsten color balance for an outside photo of a ski slope and resulted in overexposing the blue pixels.
 In this photo of ski slope blue is overexposed.
Histogram reveals that tungsten color setting gives you bad color balance.
You can take a quick glance at a color histogram like this after you take a photo and you'll be able to right away see if all three color groups are within the border of your histogram. If they're not, you know you need to make an adjustment.
How to Get Good at Reading Histograms
One of the most effective (and fun!) ways to get good at reading histograms is to make a game of it. Photography is supposed to be fun and adding a little playful element to the learning process makes it more enjoyable and easier.
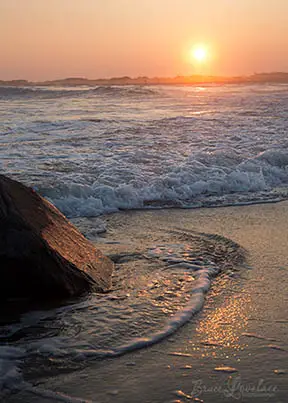
 In this high key (mostly light tones) beach photo I knew I'd have to add exposure from what my camera light meter would shoot for an average subject. I adjusted the exposure compensation until the highlights were touching the right side in the histogram.
Try to imagine what a picture's histogram will look like before you press your camera's shutter button.
- Shoot a variety of subjects and observe the bright and dark areas of your scene.
- Look at the histogram after each photo.
- Adjust exposure by using the exposure compensation on your camera to see how your histogram is affected.
I admit, using your camera's histogram may seem a bit geeky at first, reserved for camera nerds like me. There's a reason s many cameras have them as one of the included features. They are helpful. I understand we're all reluctant to learn about something, that at first glance, seems too complicated.
Trust me. It's like riding a bike. Once you learn how it will really help you get where you want to go.
Stay inspired with your photography!

ABOUT BRUCE LOVELACE
Bruce is the publisher of this website. He is the author of the book "Improve Your Photography Instantly." Read more on Bruce on his Bio Page. He's been known as The Traveling Photographer ever since 1994. Read more about this website.
View some of Bruce's photos on Instagram. Visit the Facebook Page. Watch him on YouTube. Bruce runs photo workshops for kids and adults, and provides one-on-one photography coaching.
Digital Photography Education Location on Google My Business
You might like these
Definition of Aperture. Why You Need To Know How it Affects Your Photo
It affects sharpness and what's in focus. The definition of aperture that digital photographers should be aware of and how it affects your photographs
21 Digital Camera Settings. When to Use Each Mode For Great Photos
Easy explanation of how to use the best digital camera settings, digital camera functions. What digital camera mode should you use?
What is Bulb Exposure And How to And Why Use Bulb Mode To Take Photos
What is the bulb exposure mode setting and tips on how to use it. 6 examples of when you should use the "B" bulb setting on your camera for breathtaking photos
Basic Explanation: How Cameras Work For Beginners-Means Better Photos
This simple diagram and explanation will help you take better photos. How Cameras Work. Easy way to understand shutter speed and f/stop.
Which is Sharper, Raw vs JPG? Is Raw Better Than JPG. Simple Answer
You want sharper photos so you need to know which gives you sharper and better photos. Article reveals a surprising suggestion.


example of unusual histogram
 A first look at the histogram and you might think the photo was underexposed. The large area on the left of the histogram is actually right where it should be. That's all of the darkness of the shadow areas of the photo. You can judge the exposure by observing that they are not squashed up against the left edge of the histogram.
 Histogram of Campfire Scene Above
RELATED ARTICLES
More Terms Used in Photography
Improve your photography instantly. Get the 2 most important chapters of my photography book for free.